import numpy as np
import matplotlib.pyplot as plt
from utils import *

%matplotlib inlineClustering k=means
Definition
Clustering is grouping data points in groups.
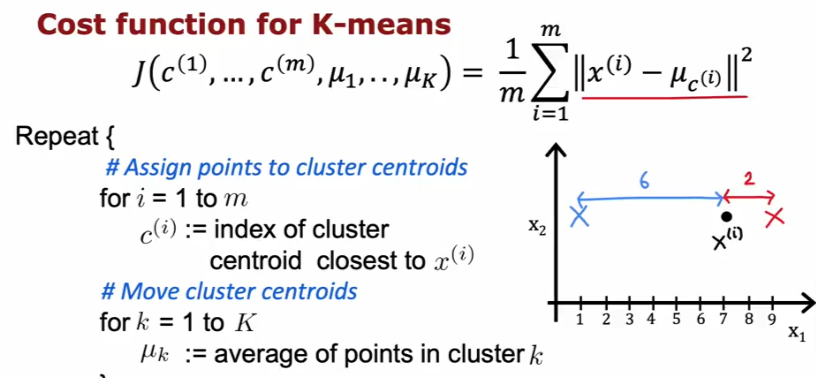
- K-means will go through by assigning cluster centroids (let’s say red and blue) and measure the distance to every point in the data
- It will color the points closer to it red if the centroid is red
- It will average the distance to all the data colored for that centroid
- It will move the centroids to the center point or the average it just calculated
- Then it will start over again and remeasure all the distances and averages them
- Move the centroids again and keep repeating the process till it assigns all the points to the nearest centroid
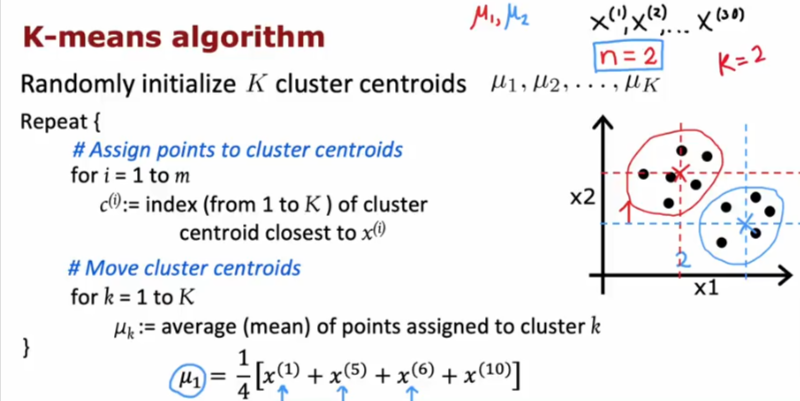
The number of cluster assigment variables c(i) is equal to the number of training examples
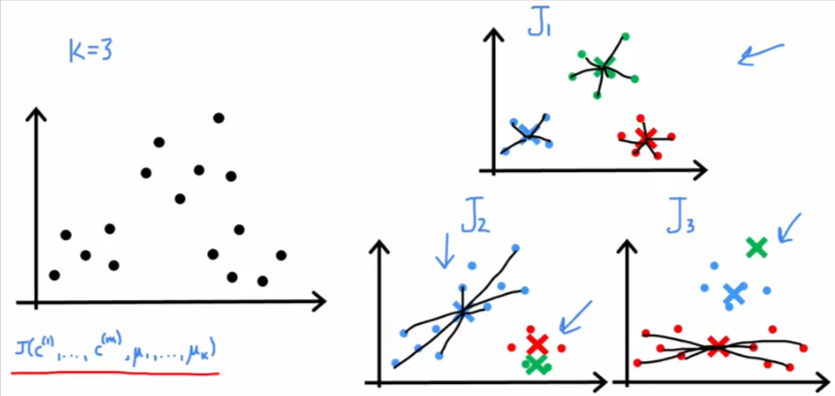
If we are running K-means with K=3 clusters, then each c(i) will be 1, 2 or 3
If each example x is a vector of 5 numbers, then each cluster centroid \(\mu\) k is also going to be a vector of 5
Optimization
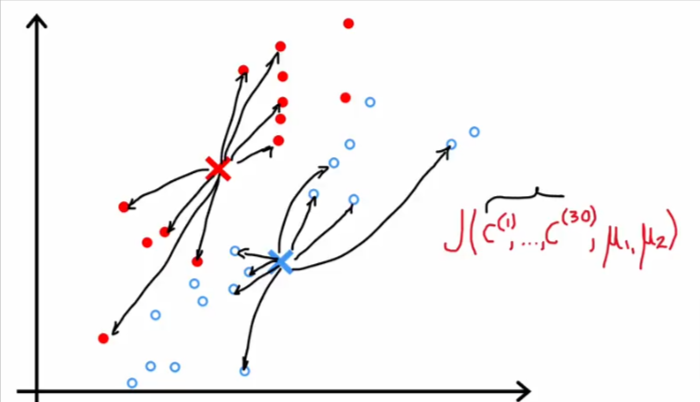
In all reality, k-means is trying to optimize the centroid locations while in the process of determining their locations. It is actually calculating the value of the cost function J() at each location it chooses for the centroids.
- It tries to update the cluster assignments C1 through C30
- Or Update the positions of the cluster centralism mu1 and mu2 in order to keep reducing this cost function
- If you run K-means 100 times, the cost function will decrease or stay the same after each iteration
Initialize K-means
So how to we choose the initial centroids of the clusters in order to run the algorithm. Is there an optimum starting point?
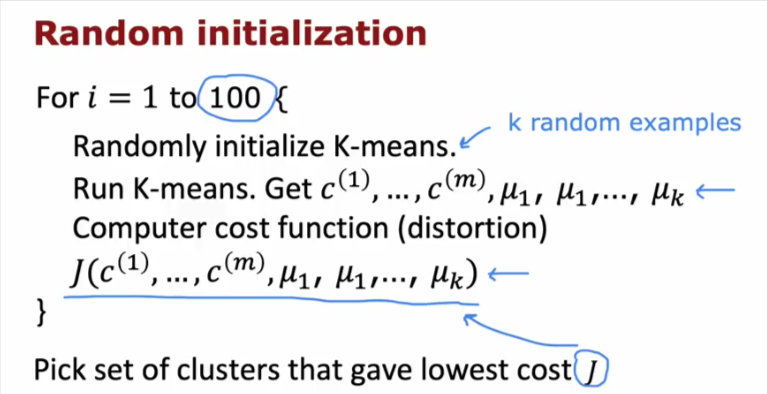
Random Initialization
- Randomly pick K training examples
- Set mu1,….muk equal to these examples
- There is a chance that both centroids start out near each other
- So you have to run it many times (100) to minimize the fact that you might end up with this scenario
- You want it to give it a better chance to find the optimal starting locations
- If we run the algorithm 3 times then we can calculate the cost function to all 3 and choose the one that has the lowest
Here is the recap for it
Number of Clusters
So how do we know how many clusters we are going to have so we can choose the value of K to begin with?
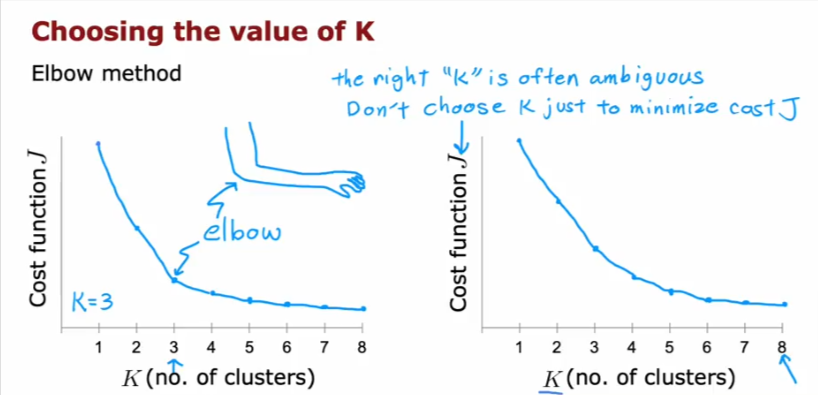
Elbow Method
- Some use this method, which is to choose based on the cost function for the number of clusters.
- The issue is since the value always decreases, then the more number of clusters you choose the cost function will be lowest
- So don’t do that, choose a reasonable value where the return diminishes
- Or don’t use this method
Use Case Method
I would choose the number of clusters based on what I am planning on using the results for. If I am looking to use 5 shirt sizes then use K=5. If I was to only use SML sizes then use K=3
Code
The K-means algorithm is a method to automatically cluster similar data points together.
- Concretely, you are given a training set {𝑥(1),…,𝑥(𝑚)}{x(1),…,x(m)}, and you want to group the data into a few cohesive “clusters”.
- K-means is an iterative procedure that
Starts by guessing the initial centroids, and then
Refines this guess by
Repeatedly assigning examples to their closest centroids, and then
Recomputing the centroids based on the assignments.
In pseudocode, the K-means algorithm is as follows:
  # Initialize centroids
  # K is the number of clusters
  centroids = kMeans_init_centroids(X, K)

  for iter in range(iterations):
      # Cluster assignment step:
      # Assign each data point to the closest centroid.
      # idx[i] corresponds to the index of the centroid
      # assigned to example i
      idx = find_closest_centroids(X, centroids)

      # Move centroid step:
      # Compute means based on centroid assignments
centroids = compute_centroids(X, idx, K)- The inner-loop of the algorithm repeatedly carries out two steps:
- Assigning each training example 𝑥(𝑖)x(i) to its closest centroid, and
- Recomputing the mean of each centroid using the points assigned to it.
- The 𝐾K-means algorithm will always converge to some final set of means for the centroids.
- However, the converged solution may not always be ideal and depends on the initial setting of the centroids.
Therefore, in practice the K-means algorithm is usually run a few times with different random initializations.
One way to choose between these different solutions from different random initializations is to choose the one with the lowest cost function value (distortion).
Find Centroids
We will write a function:
This function takes the data matrix
Xand the locations of all centroids insidecentroidsIt should output a one-dimensional array
idx(which has the same number of elements asX) that holds the index of the closest centroid (a value in {0,…,𝐾−1}{0,…,K−1}, where 𝐾K is total number of centroids) to every training example . (Note: The index range 0 to K-1 varies slightly from what is shown in the lectures (i.e. 1 to K) because Python list indices start at 0 instead of 1)Specifically, for every example 𝑥(𝑖)x(i) we set
𝑐(𝑖):=𝑗thatminimizes||𝑥(𝑖)−𝜇𝑗||2,c(i):=jthatminimizes||x(i)−μj||2,
where
𝑐(𝑖)c(i) is the index of the centroid that is closest to 𝑥(𝑖)x(i) (corresponds to
idx[i]in the starter code), and𝜇𝑗μj is the position (value) of the 𝑗j’th centroid. (stored in
centroidsin the starter code)||𝑥(𝑖)−𝜇𝑗||||x(i)−μj|| is the L2-norm
def find_closest_centroids(X, centroids):
    """
    Computes the centroid memberships for every example

    Args:
        X (ndarray): (m, n) Input values
        centroids (ndarray): (K, n) centroids

    Returns:
        idx (array_like): (m,) closest centroids

    """

    # Set K
    K = centroids.shape[0]

    # You need to return the following variables correctly
    idx = np.zeros(X.shape[0], dtype=int)

    for i in range(X.shape[0]):
        # Array to hold distance between X[i] and each centroids[j]
        distance = []
        for j in range (centroids.shape[0]):
                norm_ij = np.linalg.norm(X[i] -  centroids[j])
                distance.append(norm_ij)

        idx[i] = np.argmin(distance)
    return idx
Data
# Load an example dataset that we will be using
X = load_data()print("First five elements of X are:\n", X[:5])
print('The shape of X is:', X.shape)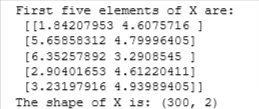
Initialize K
# Select an initial set of centroids (3 Centroids)
initial_centroids = np.array([[3,3], [6,2], [8,5]])

# Find closest centroids using initial_centroids
idx = find_closest_centroids(X, initial_centroids)

# Print closest centroids for the first three elements
print("First three elements in idx are:", idx[:3])
Centroid Means
Let’s calculate the distance to every centroid, then we recompute the mean of the points assigned to each centroid.
- Specifically, for every centroid 𝜇𝑘μk we set
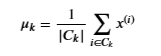
where
- 𝐶𝑘Ck is the set of examples that are assigned to centroid 𝑘k
- |𝐶𝑘||Ck| is the number of examples in the set 𝐶𝑘Ck
- Concretely, if two examples say 𝑥(3)x(3) and 𝑥(5)x(5) are assigned to centroid 𝑘=2k=2, then you should update 𝜇2=12(𝑥(3)+𝑥(5))μ2=12(x(3)+x(5)).
def compute_centroids(X, idx, K):
    """
    Returns the new centroids by computing the means of the
    data points assigned to each centroid.

    Args:
        X (ndarray):   (m, n) Data points
        idx (ndarray): (m,) Array containing index of closest centroid for each
                       example in X. Concretely, idx[i] contains the index of
                       the centroid closest to example i
        K (int):       number of centroids

    Returns:
        centroids (ndarray): (K, n) New centroids computed
    """

    # Useful variables
    m, n = X.shape

    # You need to return the following variables correctly
    centroids = np.zeros((K, n))

    for k in range(K):
          # get a list of all data points in X assigned to centroid k
          points = X[idx == k]
          # compute the mean of the points assigned
          centroids[k] = np.mean(points, axis =0)

    return centroids
K = 3
centroids = compute_centroids(X, idx, K)
print("The centroids are:", centroids)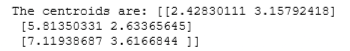
Run K-means
Sample Dataset
We will run the K-means algorithm on a toy 2D dataset to help you understand how K-means works.
- We encourage you to take a look at the function (
run_kMeans) below to understand how it works. - Notice that the code calls the two functions you implemented in a loop.
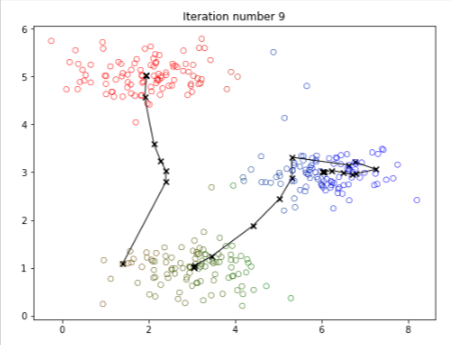
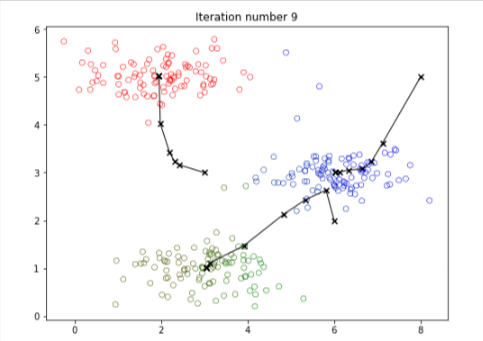
When you run the code below, it will produce a visualization that steps through the progress of the algorithm at each iteration.
- At the end, your figure should look like the one displayed in Figure 1.
- The final centroids are the black X-marks in the middle of the colored clusters.
- You can see how these centroids got to their final location by looking at the other X-marks connected to it.
def run_kMeans(X, initial_centroids, max_iters=10, plot_progress=False):
    """
    Runs the K-Means algorithm on data matrix X, where each row of X
    is a single example
    """

    # Initialize values
    m, n = X.shape
    K = initial_centroids.shape[0]
    centroids = initial_centroids
    previous_centroids = centroids
    idx = np.zeros(m)
    plt.figure(figsize=(8, 6))

    # Run K-Means
    for i in range(max_iters):

        #Output progress
        print("K-Means iteration %d/%d" % (i, max_iters-1))

        # For each example in X, assign it to the closest centroid
        idx = find_closest_centroids(X, centroids)

        # Optionally plot progress
        if plot_progress:
            plot_progress_kMeans(X, centroids, previous_centroids, idx, K, i)
            previous_centroids = centroids

        # Given the memberships, compute new centroids
        centroids = compute_centroids(X, idx, K)
    plt.show()
    return centroids, idx
# Load an example dataset
X = load_data()
# Set initial centroids
initial_centroids = np.array([[3,3],[6,2],[8,5]])
# Number of iterations
max_iters = 10
# Run K-Means
centroids, idx = run_kMeans(X, initial_centroids, max_iters, plot_progress=True)
Random Initialization
We will now choose a random starting points
- The code first randomly shuffles the indices of the examples (using
np.random.permutation()). - Then, it selects the first 𝐾K examples based on the random permutation of the indices.
- This allows the examples to be selected at random without the risk of selecting the same example twice.
def kMeans_init_centroids(X, K):
    """
    This function initializes K centroids that are to be
    used in K-Means on the dataset X

    Args:
        X (ndarray): Data points
        K (int):     number of centroids/clusters

    Returns:
        centroids (ndarray): Initialized centroids
    """

    # Randomly reorder the indices of examples
    randidx = np.random.permutation(X.shape[0])

    # Take the first K examples as centroids
    centroids = X[randidx[:K]]

    return centroids
Let’s run K-means now
# Set number of centroids and max number of iterations
K = 3
max_iters = 10

# Set initial centroids by picking random examples from the dataset
initial_centroids = kMeans_init_centroids(X, K)

# Run K-Means
centroids, idx = run_kMeans(X, initial_centroids, max_iters, plot_progress=True)