Model Evaluation
Define Train/Test
This concept involves dividing your data set into two parts: the training and the test sets. While the training set educates the model on patterns within the data, the test set evaluates its ability to generalize to new, unseen data.
For instance, imagine you’re predicting house prices based on features like size, bedrooms, and location. You’d split your data into training and testing sets, allowing the model to learn from one and be tested on the other. This process ensures you can assess the model’s performance accurately.
In this scenario, 80% of the data set is allocated for training (X_train and y_train), while the remaining 20% is allocated for testing (X_test and y_test). By specifying the random_state parameter, the split becomes reproducible. This means that executing the code with the same random_state value will consistently produce the same split, ensuring consistency across multiple runs.
Classification Models
Accuracy Percentage
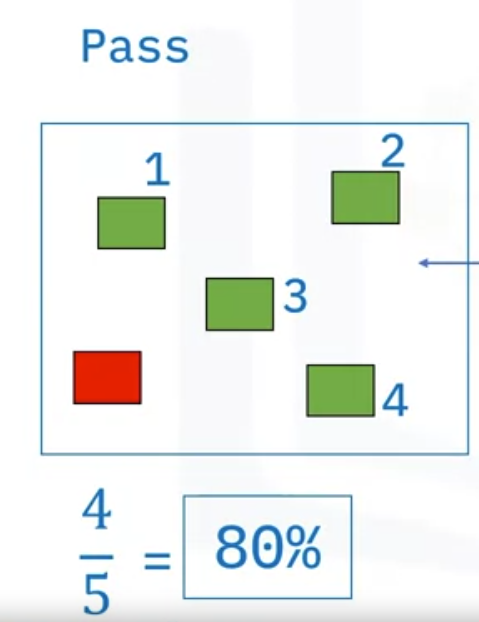
You could take the number of observations the model predicted accurately and divide it by the total number of observations to get the percent accuracy.
Confusion Matrix

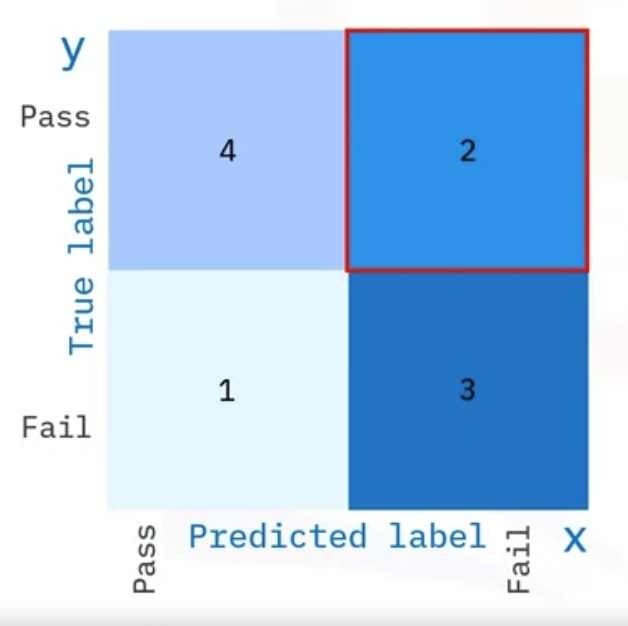
A confusion matrix is a table with combinations of predicted values compared to actual values. It measures the performance of the classification problem. On the y-axis, you have the True label and on the x-axis, you have the Predicted label.
- True positive means you predicted pass and it was pass.
- True negative means you predicted fail and it was fail.
- False positive means you predicted pass, but it is actually fail.
- False negative means you predicted fail and it is actually pass.
| Actual/predicted | Pass | Fail |
|---|---|---|
| Pass | TP | FN |
| Fail | FP | TN |
Accuracy
A good thing about the confusion matrix is that it shows the model’s ability to correctly predict or separate the classes. In the specific case of a binary classifier, such as this example, we can interpret the numbers in the boxes as the count of true positives, true negatives, false positives, and false negatives.
Precision
When evaluating a classification model, accuracy alone is not always enough. In some situations, a data scientist will look at other metrics. Evaluating precision, let’s look at our “pass or fail” example.

- Looking only at our pass class, precision is the fraction of true positives among all the examples that were predicted to be positives.
Precision is “Total correct predicted pass” divided by “Total observations as pass,” which is 4/5, or 80%. It would be the upper left cell divided by the total of the left column (4/5) = 80%
Mathematically speaking, it is the true positives divided by the sum of true and false positives. Looking at the Confusion Matrix would be the left column upper row divided by the total of the left column (4/5)
Precision involves the cost of failure, so the more false positives you have, the more cost you incur.
For example, precision may be more important than accuracy with a movie recommendation engine because it may cost more to promote a certain to movie to a user. If the movie was a false positive, meaning that the user isn’t interested in the movie that was recommended, then that would be an additional cost with no benefit.
Recall
Recall is the fraction of true positives among all the examples that were actually positive. Which would be the left cell divided by the total of the upper row (4/6)=66.7%
Mathematically speaking, it is the number of true positives divided by the sum of true positives and false negatives.
When you have a situation where opportunity cost is more important—that is, when you give up an opportunity when dealing with a false negative—recall may be a more important metric. An example of this is in the medical field.
- It’s important to account for false negatives, especially when it comes to patient health.
- Imagine that you are in the medical field and have incorrectly classified patients as having an illness. That is very important because you could be treating the wrong diagnosis.
F1
In cases where precision and recall are equally important, you can’t try to optimize one or the other. The F1-score, which is defined as the harmonic or balanced mean of precision and recall, can be used in this situation.
- It is calculated as (2 X Precision X Recall)/ (Precision + Recall)
- Rather than manually trying to strike the balance between precision and recall, the F1-score does that for you.
Regression Models

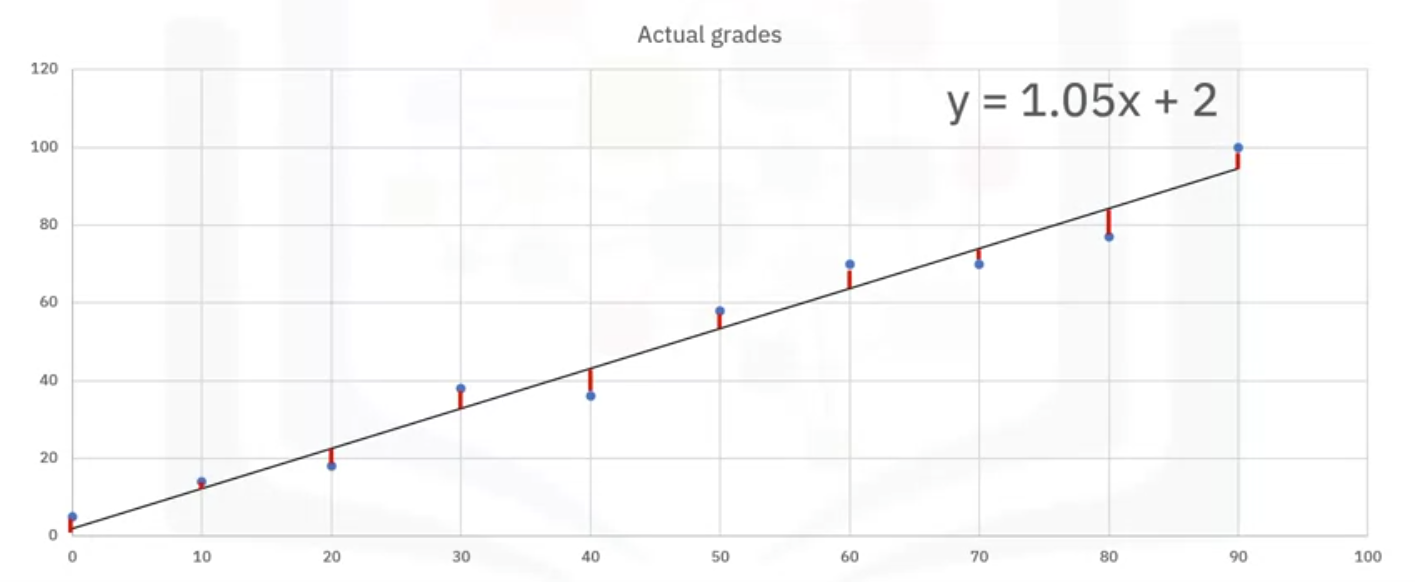
- Consider a grades example where you want to know the grade you will get on your final exam, given your midterm scores.
- You have fit your regression line and the dots in blue are the grades the students received.
Errors
The differences between the line and the blue dots are called errors. That is, the predicted values minus the actual values.
There are many ways in which you can evaluate the performance of a regression model, the first is
Mean squared Error - MSE
Mean squared error, or MSE, is the average of squared differences between the prediction and the true output. The aim is to minimize the error, in this case MSE.
- The lower the MSE, the closer the predicted values are to the actual values and the stronger and more confident you can be in your model’s prediction.
Root MSE - RMSE
Another variation of error measurement is the root mean squared error, or RMSE.
It is the square root of the MSE and has the same unit as your target variable, making it easier to interpret than the MSE.
Mean Absolute Error - MAE
You also have the mean absolute error, or MAE, which is the average of the absolute values of the errors.
- Lower MAE indicates better model performance.
R-Squared
R-squared is the amount of variance in the dependent variable that can be explained by the independent variable.
- It is also called the coefficient of determination and measures the goodness of fit of the model.
- The values range from zero to one, with zero being a badly fit model and one being a perfect model.
- Values between zero and one are what you can expect from real-world scenarios as there is no perfect model in real life.
- Higher R2 values, which range from 0 to 1, signify better model performance.
Mean absolute percentage error (MAPE)
- MAPE quantifies accuracy as a percentage of the error.

Median absolute error
- Median absolute error is robust to outliers because it uses the median instead of the mean.
- Useful when your data has outliers that could skew the error metrics.