Machine Learning Overview
AI tries to make computers intelligent enough to mimic humans’ cognitive functions. So, AI is a general field with a broad scope, including computer vision, language processing, creativity, and summarization.
Machine learning (or ML) is the branch of AI that covers the statistical part of artificial intelligence. It teaches the computer to solve problems by looking at hundreds or thousands of examples, learning from them, and then using that experience to solve the same problem in new situations.
Deep learning is an exceptional field of machine learning where computers can learn and make intelligent decisions independently. Deep learning involves a deeper level of automation in comparison to most machine learning algorithms. Deep learning deals with algorithms inspired by the human brain and how humans learn.
Branches of the machine learning field include the following:
- Natural language processing encompasses how a machine understands written or spoken human language.
- Computer vision deals with how computers see and understand digital images.
- Reinforcement learning includes teaching a machine to make decisions by rewarding desired actions and punishing undesired actions.
Lifecycle
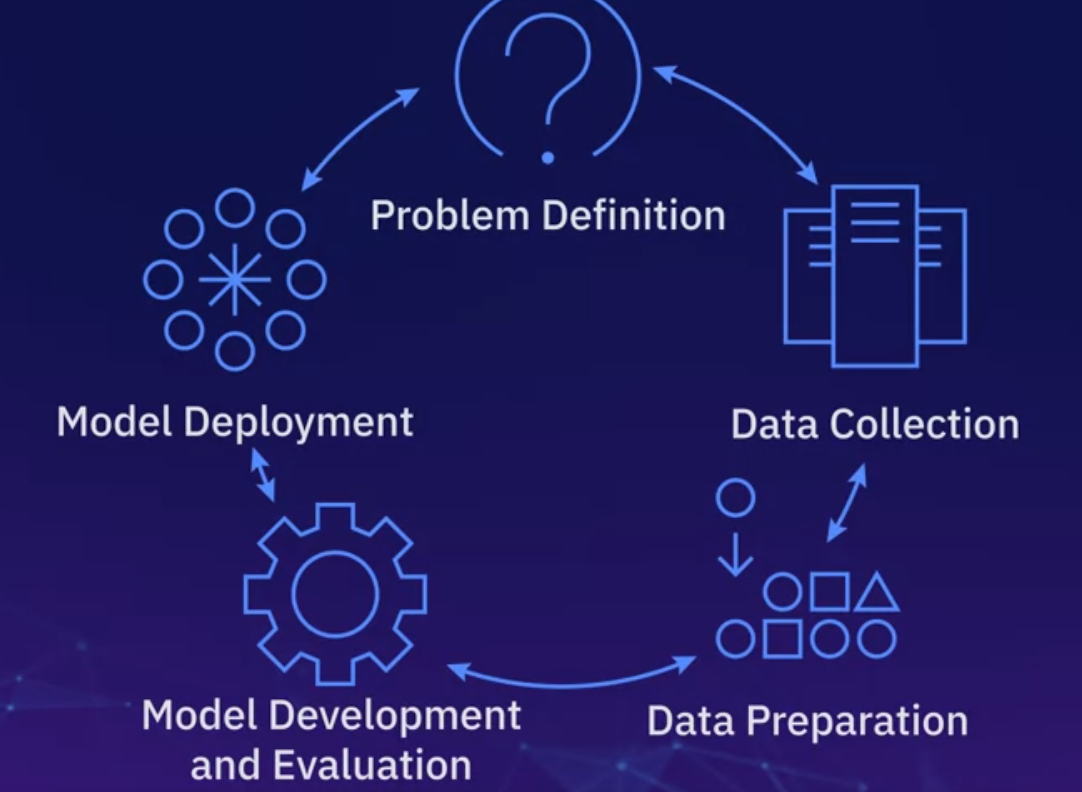
- First you Define the problem or state the situation
- Data Collection
- Data Preparation
- Model Development and Evaluation
- Model Deployment
- Re-iterate
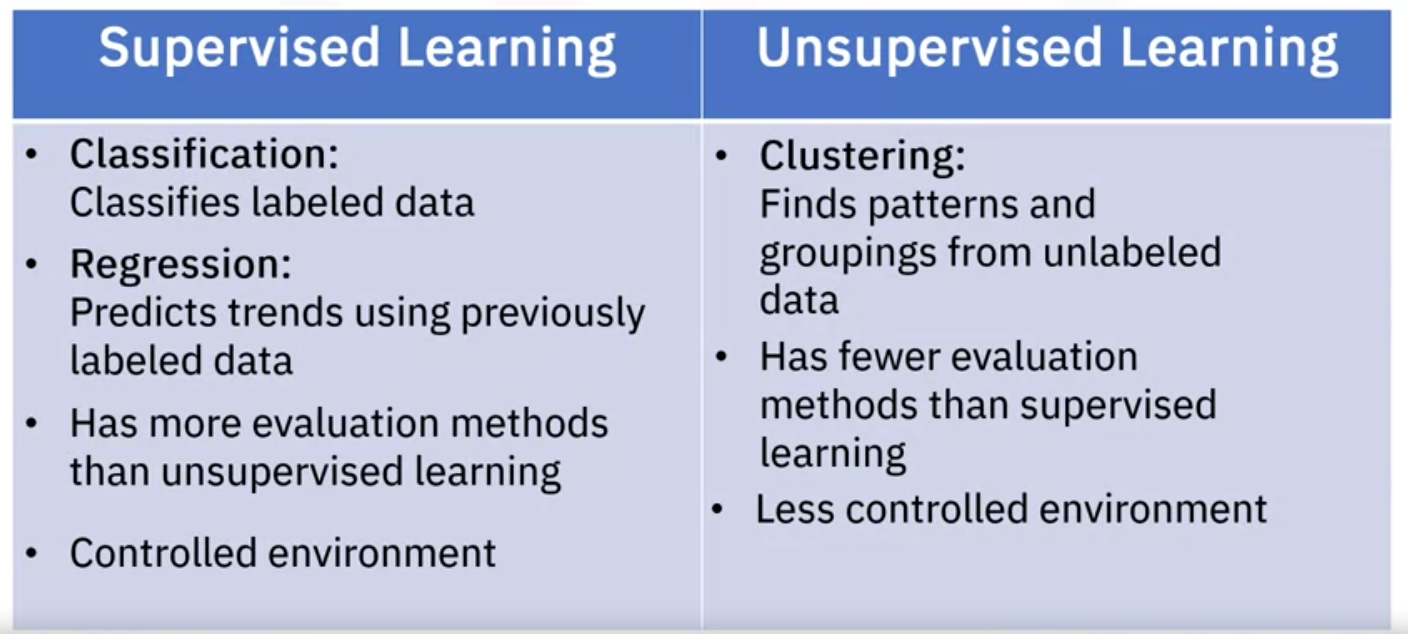
The two categories for machine learning are supervised and unsupervised learning.
Supervised Learning
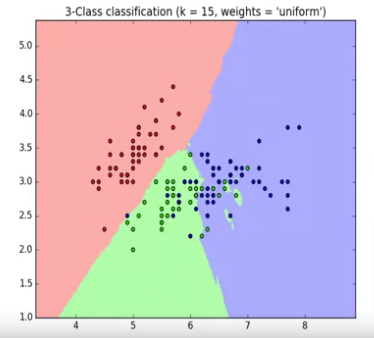
Supervised learning uses labeled data to train your model. The most popular models used are Regression and Classification models. Think of it as this: we provide the machine an input X and we ask it to predict an output Y. So we are going to be supervising a machine learning model that might be able to produce a classification of a dataset into its respective subcategories/regions/classes (clssification model) or predict an infinite number (regression).
How to Teach Model
So, how do we supervise a machine learning model? We do this by “teaching” the model. We load the model with the knowledge to predict future instances. But this leads to the next question. “How exactly do we teach a model?”
We teach the model by training it with some data from a labeled data set.
- A labeled data set categorizes data into classes.
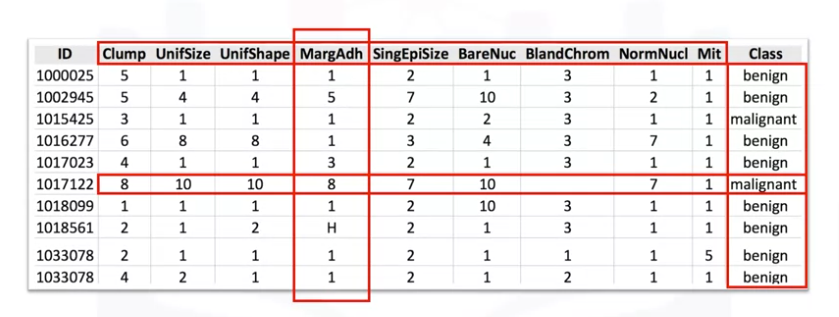
- For example, if we had data about cancer, labels could include ‘benign’ or ‘malignant.’
- As you can see, we have some historical data for patients, and we know the class of labels of each row.
Let’s start by introducing some components of this table.
- The names up here, which are called clump thickness, uniformity of cell size, uniformity of cell shape, marginal adhesion, and so on, are called features.
- The columns are called features or input variables, including the data.
- If you plot this data and look at a single data point on a plot, it will have all these attributes.
- These attributes form a row on this chart, also referred to as an observation.
Looking at the data, you may notice two types:
- The first is numerical. When dealing with machine learning, this is the most used data type.
- The second is categorical. That is, non-numeric data because it contains characters rather than numbers. In this case, it’s categorical because this data set is made for classification.
There are two types of supervised learning techniques: Classification and Regression.
Classification
Classification is the process of predicting a class or category out of an input. The output can be one of two categories of multiple categories, but the categories are predefined. So we provide the model with an input X and we ask it to predict which class/category it belongs to (note: the categories are predefined)
- Classification techniques are used for predicting the class or category of a case. For example, if a cell is benign or malignant, or whether a customer will churn.
- For example, “Will I pass or fail my biology test”?
- In this case, there are only two outcomes, and I can only be bucketed in one at a time; for example, either I will pass, or I will fail the exam.
Regression
Regression is the relationship between a dependent and an independent variable. The dependent variable is a continuous variable that we want to predict, and the independent variables are the variables that, we believe, influence the value of the dependent variable. In a simple way, we provide the model an input X and we want it to predict an infinite number Y (note the output is NOT predefined as it is in classification models)
- Regression techniques are used for predicting a continuous value. For example, predicting the price of a house based on its characteristics or estimating the CO2 emission from a car’s engine.
- Unlike classification, the outcome that we want to predict is a continuous variable rather than a categorical value.
- Look at this data set.
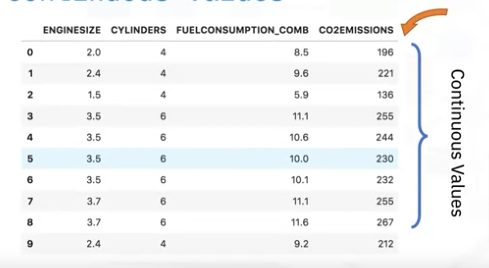
- Assume we want to predict the CO2 emissions of a new car that is not listed in this data set.
- CO2 emission is the dependent variable because it is what we want to predict, and it is a continuous variable.
- We know the values of its engine size, cylinders, and fuel consumption, these are the independent variables because, we believe, these variables influence the CO2 emission.
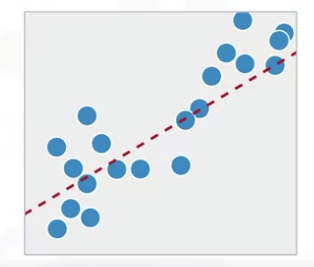
- Given this data set and the information you have based on the independent variable, you can calculate a regression line to predict the CO2 emission of a car.
Since we know the meaning of supervised learning, what do you think unsupervised learning means?
Unsupervised Learning
Unsupervised learning is precisely as it sounds. We do not supervise the model, but we allow it to work independently to discover patterns and structures in the data that may not be visible to the human eye. This means that the unsupervised algorithm trains on the data set and draws conclusions based on the unlabeled data on its own. We only provide inputs X but not output labels Y. The Algorithm has to find STRUCTURE in the data, patterns, clusters…
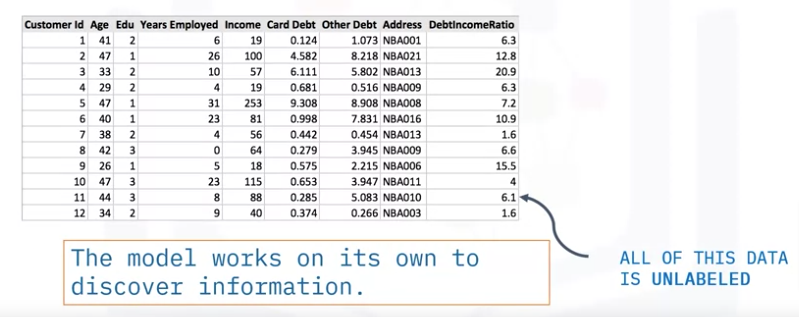
- Unsupervised learning uses unlabeled data and algorithms to detect patterns in the data. An example of unsupervised learning is clustering.
- Unsupervised learning uses more difficult algorithms than supervised learning because we know little to no information about the data or the outcomes that are to be expected.
Unsupervised learning techniques that are most widely used are:
Anomaly Detection
Is used to detect unusual events. Used a bit in the financial market to detect unusual events, transactions
Dimensionality Reduction
Dimensionality reduction and/or feature selection plays a significant role in unsupervised learning by reducing redundant features to make the classification easier. It compressed data using fewer numbers without sacrificing any relevance
Market Basket Analysis
Market basket analysis is a modeling technique based upon the theory that if you buy a particular group of items, you are more likely to buy another group of items.
Density Estimation
Density estimation is a straightforward concept mainly used to explore the data and find some structure.
Clustering
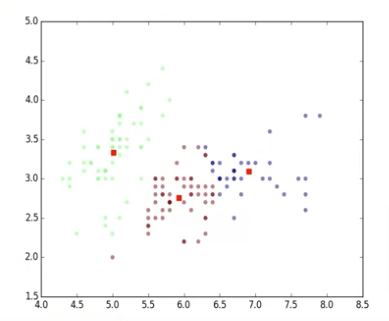
Clustering is one of the most popular unsupervised machine learning techniques, let us look at it more in-depth.
Clustering works by grouping data points or objects that are somehow similar by the characteristics of the data.
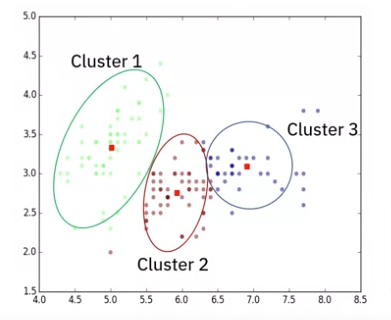
Clustering is mainly used for
- Discovering the structure of the data
- Summarizing the data
- Detecting anomalies within a data set.
Cluster analysis has many applications in different domains, whether helping a bank segment its customers, based on specific characteristics, or assisting an individual group with their favorite types of music!
Clustering algorithms are used to group similar cases, for example, they can be used to find similar patients or to segment bank customers.
Looking ahead to Regression Models here is a preview

ML Pipeline
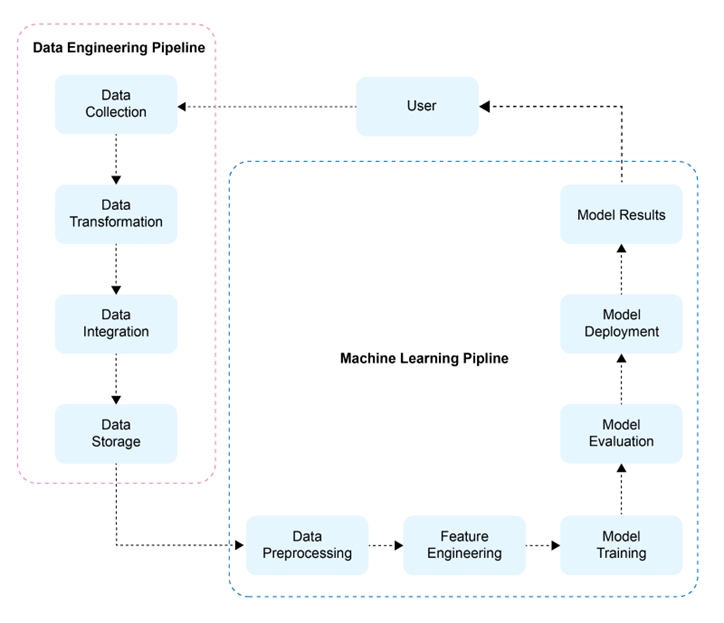
Data Engineering Pipeline
In today’s data-driven world, organizations are constantly seeking valuable insights and using advanced algorithms to make informed decisions. Data engineering pipelines are the foundation of successful data-driven projects. They handle the collection, transformation, and storage of large amounts of raw data. Data engineers design and implement robust systems to handle data at scale. They use tools and technologies to clean, transform, and integrate different data sources into a reliable format.
Data quality is essential in data engineering. Engineers create efficient data pipelines to process data smoothly. These pipelines involve extracting data from various sources, making necessary changes, and storing it in storage or analytical systems. Data engineers collaborate with data scientists, analysts, and stakeholders to understand their needs and provide them with clean and accessible data.
Let’s take a closer look at the four key parts that make up the data engineering pipelines:
Data Collection: Data engineers are responsible for gathering data from various sources. This includes databases, APIs, web scraping, streaming platforms, and more. By combining data from multiple sources, data engineers ensure a comprehensive and diverse dataset to work with.
Data Transformation: Once the data is collected, it undergoes a series of transformations to ensure its quality and usefulness. This involves preprocessing steps such as cleaning the data to remove errors and inconsistencies, handling missing values, and addressing outliers. Data engineers also apply techniques like data normalization and standardization to ensure uniformity and comparability across different data points.
Data Integration: Organizations often deal with data coming from different sources and in different formats. Data engineers play a crucial role in integrating this unrelated data to create a unified and coherent dataset. This involves merging data from various sources, performing data joins to combine related information, and aggregating data to obtain a consolidated view.
Data Storage: The processed and integrated data needs to be stored in a suitable repository for easy accessibility and scalability. Data engineers utilize data warehousing systems or data lakes to store the data securely and efficiently. These repositories provide the foundation for further analysis and serve as a centralized hub for data-driven operations.
Machine Learning Pipelines
Machine learning pipelines play a crucial role in extracting valuable insights from data using algorithms. These pipelines cover the entire process of creating, training, and deploying machine learning models.
Data scientists and machine learning engineers collaborate closely to optimize the pipelines and improve model performance. Techniques such as data sampling, feature extraction, and model selection ensure accurate predictions and meaningful outputs. Additionally, concepts like cross-validation, hyperparameter tuning, and effective model deployment strategies are incorporated into machine learning pipelines to create robust and scalable solutions.
Let’s explore the five essential parts that make up these pipelines:
Data Preprocessing: Raw data often requires preprocessing before it can be used effectively for machine learning tasks. Data preprocessing involves handling missing values, dealing with categorical variables by encoding or one-hot encoding them, and normalizing numerical features to bring them within a consistent range. This step ensures that the data is in a suitable format for the subsequent stages of the pipeline.
Feature Engineering: Feature engineering is the process of selecting, creating, or transforming features in the dataset to enhance the performance of machine learning models. This involves extracting relevant features, creating new features based on domain knowledge, or applying techniques like dimensionality reduction to reduce the complexity of the data. Feature engineering plays a crucial role in capturing the underlying patterns and relationships in the data.
Model Training: In this stage, machine learning algorithms are applied to the preprocessed and engineered dataset to learn patterns and make predictions. Data scientists and machine learning engineers select the appropriate algorithms based on the nature of the problem and the available data. The models are trained using labeled data, allowing them to learn from the patterns and make accurate predictions or classifications.
Model Evaluation: Trained models need to be evaluated to assess their performance and generalizability. Various metrics, such as accuracy, mean squared error(MSE), precision, recall, and F1 score, are used to evaluate the models’ predictive capabilities. Cross-validation techniques are employed to validate the models’ performance on unseen data, ensuring that they can generalize well beyond the training data.
Model Deployment: The best-performing model is deployed into a production environment, where it can make predictions or generate insights on new and unseen data. This stage involves integrating the model into existing systems or creating APIs that allow for easy integration with other applications. Model deployment strategies ensure that the models are scalable, robust, and capable of handling real-time data streams.
Machine learning pipelines empower organizations to leverage algorithms effectively and make data-driven decisions, enabling automation, optimization, and predictive capabilities.
Glossary 1
| Terms | Definition | |
|---|---|---|
| AI (Artificial Intelligence) | The field of computer science aims to create intelligent machines that can mimic human cognitive functions. | |
| Anomaly Detection | An application of clustering that focuses on identifying data points that are unusual, abnormal, or deviate significantly from the established patterns or clusters. | |
| Augmented Intelligence | The concept of using AI technologies to enhance and augment human capabilities allows experts to scale their abilities while machines manage time-consuming tasks. | |
| Categorical data | Non-numeric data that represent categories or labels. | |
| Classification | A supervised learning technique that predicts the class or category of a case, such as classifying a cell as benign or malignant. | |
| Classifier | A machine learning algorithm or model is used to solve classification problems by learning patterns and making predictions about the class of new, unseen data. | |
| Cluster Centroid | Cluster centroid refers to a cluster’s representative or central point in a clustering algorithm. It is calculated as the mean or median of the data points assigned to that cluster. | |
| Clustering | An unsupervised learning technique that groups similar cases together based on their features, aiming to identify patterns or clusters within the data. | |
| Confusion Matrix | A table that summarizes a classification model’s performance by showing the counts of true positives, true negatives, false positives, and false negatives. | |
| Decision Tree | A predictive model that uses a tree-like structure to make decisions or predictions based on input features. | |
| Deep learning | An exceptional field of machine learning where computers can learn and make intelligent decisions independently. | |
| Density Estimation | An unsupervised learning technique that focuses on estimating the underlying probability density function of a dataset. | |
| Dependent variable | The continuous variable that is being predicted, explained, or estimated based on the input or independent variables | |
| Dimensionality Reduction | An unsupervised learning technique is used to reduce the number of input features while preserving valuable information. | |
| Eager Learner | A type of classification algorithm that spends time training and generalizing the model, making it faster in predicting test data. Examples include decision trees and logistic regression. | |
| Ethical Concerns | Issues and considerations related to the responsible and ethical use of AI, including potential misuse of AI-generated content and implications for intellectual property and copyright laws. | |
| Euclidean Distance | Euclidean distance is a measure of distance or similarity between two data points in a multidimensional space. | |
| Extract, Transform, and Load (ETL) | The process within the machine learning model lifecycle refers to the data collection and preparation stage. | |
| F1-Score | A metric that combines precision and recalls into a single value to assess a classification model’s overall performance. It is calculated as the harmonic mean of precision and recall, providing a balanced measure when both metrics are equally important. | |
| Feature Engineering | The process of creating new features or representations from existing data to enhance the performance and predictive capabilities of machine learning models. | |
| Feature extraction | The process in which relevant information or characteristics are extracted from raw data and transformed into a reduced and more informative representation, known as features | |
| Generative AI | A technology that uses machine learning and deep learning techniques to generate original content based on patterns learned during training, enabling software applications to create and simulate new content. | |
| Gradient Boosting | A machine learning technique that builds an ensemble of weak models like decision trees sequentially, where each subsequent model focuses on correcting the errors made by the previous models. | |
| Image Segmentation | Image segmentation is an application of clustering that involves dividing images into categories based on color, content, or other features. | |
| Independent variable | A variable that is used to explain, predict, or estimate the value of the dependent variable. | |
| K-means Algorithm | The K-means algorithm is a popular clustering algorithm that aims to divide a dataset into K clusters, where K is a user-specified parameter. | |
| k-nearest neighbor (KNN) | A lazy learner algorithm is used for classification. It classifies unknown data points by finding the k most similar examples in the training set and assigning the majority class among those neighbors to the test data point. | |
| Large Language Model (LLM) | A type of artificial intelligence model based on deep learning techniques designed to process and generate natural language, which can be incorporated into Generative AI systems. | |
| Lazy Learner | A type of classification algorithm that does not have a specific training phase. It waits until it receives test data before making predictions, often resulting in longer prediction times. | |
| Line of Best Fit | A straight line represents the best approximation of the relationship between two variables in a scatter plot. | |
| Machine learning | The subfield of computer science gives computers the ability to learn from data without being explicitly programmed. | |
| Machine Learning Model Lifecycle | The end-to-end process involved developing, deploying, and maintaining a machine learning model. | |
| Market Basket Analysis | An unsupervised learning technique used to identify associations or relationships between items in a dataset. | |
| Mean Absolute Error (MAE) | A metric that uses the absolute differences between the predicted and actual values. It calculates the average of the absolute values of the errors. | |
| Model Deployment | The process of making the trained machine learning model available for use in a production environment or real-world application. | |
| Natural language processing | The field of study that focuses on enabling computers to understand and process human language, both written and spoken. | |
| Neural Networks | A class of machine learning models inspired by the structure and functioning of biological neural networks. Neural networks consist of interconnected nodes (neurons) organized in layers and are capable of learning complex patterns from data. They are used for regression tasks as well as other types of problems. | |
| Precision | A metric that measures the fraction of true positives among all examples predicted to be positive by a classification model. | |
| Random Forest | An ensemble learning method that combines multiple decision trees to create a predictive model. | |
| Recall | Also known as sensitivity or true positive rate, recall measures the fraction of true positives among all actual positive examples. | |
| Recommendation Systems | Recommendation systems are applications of clustering that group related items or products based on customer behavior or preferences. | |
| Regression | A supervised learning technique that predicts continuous values based on input features, such as predicting the price of a house based on its characteristics. | |
| Root Mean Squared Error (RMSE) | The square root of the mean squared error. It has the same unit as the target variable and is easier to interpret than MSE. | |
| R-squared | A metric that quantifies the proportion of variance in the dependent variable that can be explained by the independent variable(s) in a regression model. It ranges from 0 to 1, with higher values indicating a better fit. | |
| Scatter Plot | A graphical representation of data points on a two-dimensional coordinate system, where each point represents the values of two variables. | |
| Slope | The slope of the line of best fit represents the rate of change in the dependent variable for a unit change in the independent variable. | |
| Squared error | A common metric used to evaluate the performance of regression models. It measures the average of the squared differences between the predicted values and the actual values of the target variable. | |
| Supervised learning | A category of machine learning where the model is trained using labeled data with known input-output pairs. | |
| Support Vector Regression (SVR) | A regression technique that uses support vector machines to create a hyperplane or line that best fits the data points. | |
| Train/Test Split | The process of dividing a dataset into two separate sets: a training set used to train a machine learning model and a test set used to evaluate the model’s performance on new, unseen data. | |
| Unsupervised learning | A category of machine learning where the model is trained using unlabeled data, and the algorithms detect patterns and relationships within the data. |
Glossary 2
| Terms | Definition | |
|---|---|---|
| Bisecting K-means | A hierarchical clustering algorithm that recursively splits clusters into smaller subclusters until the desired number of clusters is reached. | |
| Cluster monitoring | Monitoring the performance, resource usage, and overall health of the Spark cluster using built-in and third-party tools. | |
| CSV file | Comma-separated values file, a common file format for storing tabular data where a comma separates each value. | |
| Data ingestion | The process of importing large volumes of data from various sources into Spark for processing. | |
| DataFrame | A distributed collection of data organized into named columns, commonly used in Spark for data manipulation and analysis. | |
| DataFrameReader | A class in Spark that provides methods for reading data from various file formats into a DataFrame. | |
| Decision tree regression | A regression algorithm that uses a decision tree to model the relationship between the target variable and input features. | |
| Domain-Specific Language (DSL) | A programming language or syntax specifically designed to express concepts and operations within a particular domain or problem space. GraphFrames utilizes a DSL to specify search queries for motif finding. | |
| Gaussian Mixture Models (GMM) | A probabilistic model for representing data distributions often used for clustering tasks. GMM assumes that the data points are generated from a mixture of Gaussian distributions. | |
| Gradient-boosted tree regression | A regression algorithm that builds an ensemble of weak decision trees in a sequential manner to make accurate predictions. | |
| GraphFrame | A graph processing library built on top of Apache Spark that provides high-level APIs for working with graph data. It extends the capabilities of Spark’s DataFrame and Dataset APIs to enable graph computation and analysis. | |
| Hadoop MapReduce | A previous framework for distributed processing of large data sets that Spark overcomes. | |
| In-memory processing | Spark’s capability to cache data in memory eliminating the high input/output costs associated with disk-based processing. | |
| Jupyter Notebook | An interactive web-based environment for writing and running code, visualizing data, and documenting workflows. An open-source web application that allows you to create and share documents containing live code, equations, visualizations, and narrative text. |
|
| K-means | A popular clustering algorithm aims to partition the data into K clusters, where each data point belongs to the cluster with the nearest mean. | |
| Linear regression | A regression algorithm that models the relationship between the target variable and input features as a linear equation. | |
| Logistic regression | A classification algorithm that models the relationship between input features and categorical outcomes using the logistic function. | |
| MulticlassClassificationEvaluator | The MulticlassClassificationEvaluator is a class in Apache Spark’s Machine Learning (ML) library that provides evaluation metrics for multiclass classification models. It helps measure the performance of multiclass classification models by comparing their predicted class labels against the true class labels. | |
| Random forest regression | A regression algorithm that combines multiple decision trees to improve prediction accuracy. | |
| RegressionEvaluator | The RegressionEvaluator is a class in Apache Spark’s Machine Learning (ML) library that provides evaluation metrics for regression models. It helps measure the performance of regression models by comparing their predicted continuous values against the true labels or target values. | Regression using SparkML |
| Root Mean Squared Error (RMSE) | RMSE measures the average deviation between the predicted and actual values. It calculates the square root of the average of the squared differences between the predicted and true values. Lower RMSE values indicate better model performance. | |
| Scaling | Scaling is a common preprocessing technique in machine learning that helps to normalize or standardize the features of a dataset. It ensures that all the features have a similar scale or range, which can be beneficial for certain machine learning algorithms, such as those based on distance calculations or gradient descent optimization. |
|
| Sentiment analysis | A classification task that involves determining the sentiment or emotion expressed in a piece of text, such as positive, negative, or neutral. | |
| Silhouette score | A metric that measures the quality of clustering by computing the average distance between data points within clusters and the average distance to the nearest neighboring cluster. Higher silhouette scores indicate well-separated and distinct clusters. | |
| Spark | A distributed computing system that processes large-scale data sets and provides a unified computing engine for various data processing tasks. | |
| Spark Cluster | A Spark cluster is a group of computers or servers that work together to process data using Apache Spark, an open-source distributed computing system. Spark is designed to handle large-scale data processing tasks and provides a framework for distributing data across multiple machines and parallelizing computation. | |
| Spark ML | The machine learning library provided by Apache Spark for building and training machine learning models. | |
| Spark MLlib | An older name for Spark ML referring to the same machine learning library within the Spark ecosystem. | |
| Spark Session | A Spark Session is the entry point for programming with Apache Spark. It is a unified interface that allows you to interact with Spark and perform various data processing and analysis tasks. Spark Session provides a convenient way to create and manage Spark contexts, which are required to connect to a Spark cluster and execute Spark operations. | |
| SparkSession | The entry point for Spark functionality serving as a unified interface to interact with various Spark features and libraries. | |
| Stream processing | Processing real-time data streams using Spark’s capabilities. | |
| Supervised learning | A type of machine learning where the algorithm learns from labeled training data to make predictions or classify new, unseen data. | |
| VectorAssembler | The VectorAssembler is a feature transformation class in Apache Spark’s Machine Learning Library that combines multiple input columns into a single vector column. It is often used as a preprocessing step to prepare data for machine learning algorithms that expect input features in vector format. | |
| Vertex | Also known as a node, it represents an object or entity in a graph. In the context of social networks, it can represent a person, while in other domains, it can represent different entities such as web pages, products, or locations. |
Glossary 3
| Terms | Definition | |
|---|---|---|
| Checkpointing | A mechanism for recovering query progress in case of node failures and writing stream data to disk | |
| Code snippet | A small section of code that demonstrates a specific functionality or task. | |
| Data warehouse | A central repository that stores large amounts of data from various sources for analysis and reporting | |
| Distributed computing | Spark can handle large-scale data processing and machine learning tasks by distributing computations across multiple nodes in a cluster. | |
| End-to-end latency | The time is required for data to process from the source to the sink | |
| Factor analysis | A statistical method used to identify latent factors underlying observed variables in a dataset | |
| Header | The file’s first row contains the column names or labels in a tabular data format. | |
| IDF | Inverse Document Frequency (IDF) measures the rarity or uniqueness of a term across a collection of documents. You can calculate it by using the logarithm of the ratio between the total number of documents in the collection and the number of documents that contain the term. The IDF value is higher for terms that appear in fewer documents, indicating that these terms are more discriminative and provide more information about the documents in which they appear. | |
| Inference | Applying a trained machine learning model to make predictions or draw conclusions on new, unseen data | |
| JDBC (Java Database Connectivity) | A Java API that allows interaction with relational databases using SQL queries. | |
| Machine learning pipeline | A structured approach to building and deploying machine learning models, encompassing the entire process from data ingestion to model deployment | |
| MaxAbsScaler | A function in Spark for scaling numerical features by their maximum absolute value | |
| MinMaxScaler | A function in Spark for scaling numerical features to a specified range, typically between 0 and 1 | |
| Model persistence | The process of saving a trained machine learning model to disk for future use, enabling its reuse, sharing, and deployment in various applications. | |
| Model selection and training | The step in the pipeline is where the appropriate machine learning model is selected and trained using the preprocessed data. | |
| One-hot encoding | A technique that converts categorical features into numerical features suitable for machine learning | |
| Portability | The capability of loading a saved model on different computing environments or infrastructures allows for easy sharing, collaboration, and integration into various projects. | |
| Principal Component Analysis (PCA) | A dimensionality reduction technique to identify a smaller set of features that can explain the variance in a dataset | |
| Reproducibility | The ability to replicate and verify machine learning experiments or projects using the same saved model ensures consistency in findings and facilitates knowledge exchange. | |
| Result set | The output generated from executing an SQL query on a Data Frame contains the selected data based on the query criteria. | |
| Scalability | The feature of easily deploying and scaling saved models to handle large volumes of data, supporting efficient processing of big data and real-time predictions | |
| Scaling and normalization | Techniques for transforming numerical features into a common scale to prevent biases in data analysis | |
| SQL queries | Statements written in SQL syntax to retrieve, manipulate, and analyze data stored in a data frame. | |
| StandardScaler | A function in Spark for scaling numerical features to have zero mean and unit variance | |
| Streaming data | Continuously generated data[MS3][PB4]often comes from multiple sources, requiring incremental processing due to its continuous nature. | |
| TF | Term Frequency (TF) measures the frequency of a term within a document. It indicates how often a term appears in a document relative to its total number of terms. The idea behind TF is that terms that appear more frequently within a document are likely to be more important or relevant to that document’s content. | |
| TF-IDF | TF-IDF stands for Term Frequency-Inverse Document Frequency. It is a numerical statistic used in information retrieval and text mining to measure the importance of a term (or word) within a document or a collection of documents. TF-IDF combines term frequency (TF) and inverse document frequency (IDF). | |
| Tokenization | Tokenization is the process of breaking down a sequence of text into smaller units called tokens. These tokens can be individual words, phrases, sentences, or even characters, depending on the specific requirements of the task at hand. Tokenization is fundamental in natural language processing (NLP) and text analysis tasks. | |
| Unified programming interface | Spark’s consistent and integrated interface allows data scientists to work seamlessly with different data sources and machine learning algorithms. | |
| Watermarking | A process that manages late data in streaming, including late-arriving data and updating results after initial processing | |
| Word2Vec | A technique that represents words as vectors in a high-dimensional space, capturing semantic relationships between words. |