import numpy as np
import matplotlib.pyplot as plt
from sklearn.linear_model import SGDRegressor
from sklearn.preprocessing import StandardScaler
from lab_utils_multi import  load_house_data
from lab_utils_common import dlc
np.set_printoptions(precision=2)
plt.style.use('./deeplearning.mplstyle')Scikit-Learn
A useful library that contains implementations of many of the algorithms we work with
.
Gradient Descent
Scikit-learn has a gradient descent regression model sklearn.linear_model.SGDRegressor. Like your previous implementation of gradient descent, this model performs best with normalized inputs. sklearn.preprocessing.StandardScaler will perform z-score normalization as in a previous lab. Here it is referred to as ‘standard score’.
Load the Data
X_train, y_train = load_house_data()
X_features = ['size(sqft)','bedrooms','floors','age']
Scale the Data
scaler = StandardScaler()
X_norm = scaler.fit_transform(X_train)
print(f"Peak to Peak range by column in Raw        X:{np.ptp(X_train,axis=0)}")
print(f"Peak to Peak range by column in Normalized X:{np.ptp(X_norm,axis=0)}")
Create Regression Model
sgdr = SGDRegressor(max_iter=1000)
sgdr.fit(X_norm, y_train)
print(sgdr)
print(f"number of iterations completed: {sgdr.n_iter_}, number of weight updates: {sgdr.t_}")
View Parameters
b_norm = sgdr.intercept_
w_norm = sgdr.coef_
print(f"model parameters:                   w: {w_norm}, b:{b_norm}")
print( "model parameters from previous lab: w: [110.56 -21.27 -32.71 -37.97], b: 363.16")
Make Predictions
We will use both the predict routine and compute using w and b
# make a prediction using sgdr.predict()
y_pred_sgd = sgdr.predict(X_norm)
# make a prediction using w,b.
y_pred = np.dot(X_norm, w_norm) + b_norm
print(f"prediction using np.dot() and sgdr.predict match: {(y_pred == y_pred_sgd).all()}")

print(f"Prediction on training set:\n{y_pred[:4]}" )
print(f"Target values \n{y_train[:4]}")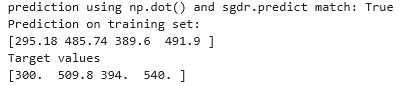
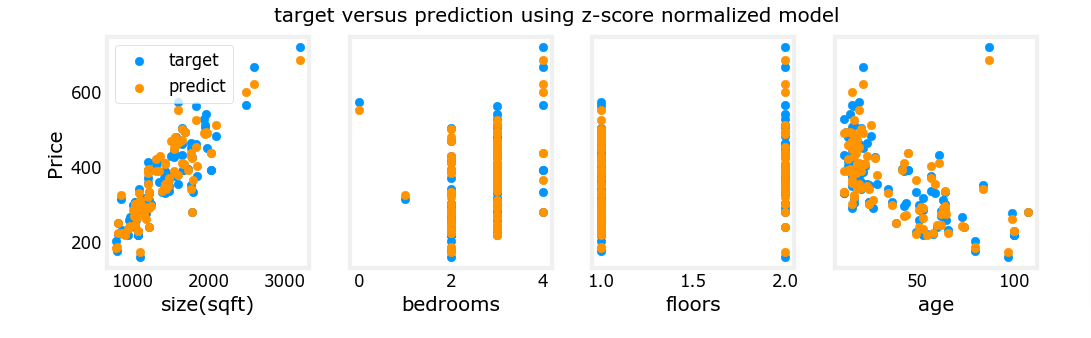
Plot Results
# plot predictions and targets vs original features
fig,ax=plt.subplots(1,4,figsize=(12,3),sharey=True)
for i in range(len(ax)):
    ax[i].scatter(X_train[:,i],y_train, label = 'target')
    ax[i].set_xlabel(X_features[i])
    ax[i].scatter(X_train[:,i],y_pred,color=dlc["dlorange"], label = 'predict')
ax[0].set_ylabel("Price"); ax[0].legend();
fig.suptitle("target versus prediction using z-score normalized model")
plt.show()